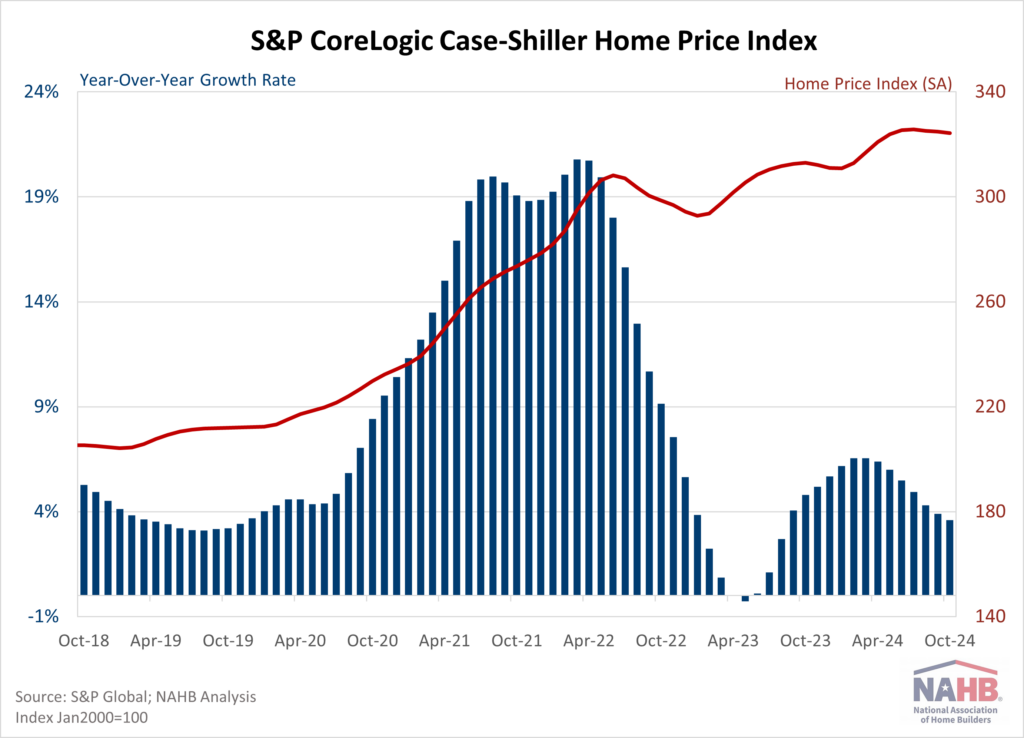
Home Price Growth Leveling Off
Onnah Dereski2025-01-28T11:18:19-06:00On a year-over-year basis, home prices grew at a rate of 3.75% for November, according to the S&P CoreLogic Case-Shiller Home Price Index (NSA). This marks an increase from the 3.59% growth rate recorded in October but is down from a peak of 6.54% in March 2024. By Metro Area In addition to tracking national home price changes, the S&P CoreLogic Index (SA) also reports home price indexes across 20 metro areas. Compared to last year, 19 of 20 metro areas reported a home price increase. There were 10 metro areas that grew more than the national rate of 3.75%. The highest annual rate was New York at 7.37%, followed by Chicago at 6.22% and Washington DC at 5.90%. Denver grew at the smallest rate at 0.92%, followed closely by Dallas at 1.02%. Tampa was the only area that experienced a decline from last year at a rate of -0.33%. By Census Division A similar index, the Federal Housing Finance Agency Home Price Index (SA) publishes not only national data but also data by census division. The national year-over-year rate was 4.22% for November. Meanwhile, the division with the highest year-over-year rate was 7.67% in New England, while the lowest was 1.81% in West South Central. A three-month trend in rates is shown for each division below. The FHFA Home Price Index releases their metro and state data on a quarterly basis, which NAHB analyzed in a previous post. Discover more from Eye On Housing Subscribe to get the latest posts sent to your email.