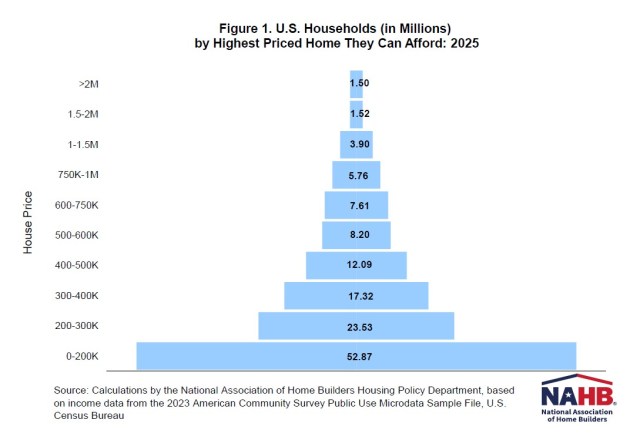
Affordability Pyramid Shows 94 Million Households Cannot Buy a $400,000 Home
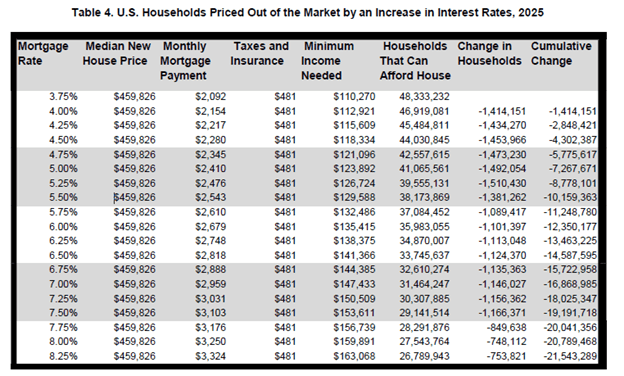
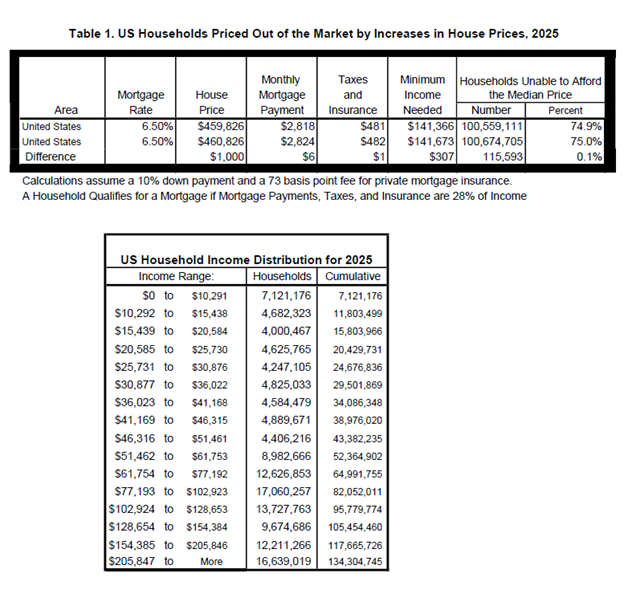
Na Zhao2025-03-31T09:20:54-05:00NAHB recently released its 2025 Priced-Out Analysis, highlighting the housing affordability challenge. While previous posts discussed the impacts of rising home prices and interest rates on affordability, this post focuses on the related U.S. housing affordability pyramid. The pyramid reveals that 70% of households (94 million) cannot afford a $400,000 home, while the estimated median price of a new home is around $460,000 in 2025. The housing affordability pyramid illustrates the number of households able to purchase a home at various price steps. Each step represents the number of households that can only afford homes within that specific price range. The largest share of households falls within the first step, where homes are priced under $200,000. As home prices increase, fewer and fewer households can afford the next price level, with the highest-priced homes—those over $2 million—having the smallest number of potential buyers. Housing affordability remains a critical challenge for households with income at the lower end of the spectrum. The pyramid is based on income thresholds and underwriting standards. Under these assumptions, the minimum income required to purchase a $200,000 home at the mortgage rate of 6.5% is $61,487. In 2025, about 52.87 million households in the U.S. are estimated to have incomes no more than that threshold and, therefore, can only afford to buy homes priced up to $200,000. These 52.87 million households form the bottom step of the pyramid. Of the remaining households who can afford a home priced at $200,000, 23.53 million can only afford to pay a top price of somewhere between $200,000 and $300,000. These households make up the second step on the pyramid. Each subsequent step narrows further, reflecting the shrinking number of households that can afford increasingly expensive homes. It is worthwhile to compare the number of households that can afford homes at various price levels and the number of owner-occupied homes available in those ranges (excludes homes built-for-rent), as shown in Figure 2. For example, while around 53 million households can afford a home priced at $200,000 or less, there are only 22 million owner-occupied homes valued in this price range. This trend continues in the $200,000 to $300,000 price range, where the number of households that can afford homes is much higher than the number of housing units in that range. These imbalances show a shortage of affordable housing. Discover more from Eye On Housing Subscribe to get the latest posts sent to your email.