Trade War Will Create Further Economic and Financial Market Stress
Diana Carroll2025-04-17T13:24:20-05:00NAHB Chief Economist Robert Dietz provided this economic and housing industry overview in the bi-weekly newsletter Eye On the Economy.
NAHB Chief Economist Robert Dietz provided this economic and housing industry overview in the bi-weekly newsletter Eye On the Economy.
Overall housing starts decreased 11.4% in March to a seasonally adjusted annual rate of 1.32 million units, according to a report from the U.S. Department of Housing and Urban Development and the U.S. Census Bureau.
NAHB has officially launched a new Member Savings program with Baytek, a premier Intuit QuickBooks and Intuit Enterprise Suite (IES) provider, giving members access to unadvertised savings, exclusive rebates, and powerful business solutions.
Builder confidence in the market for newly built single-family homes was 40 in April, edging up one point from March, according to the NAHB/Wells Fargo Housing Market Index (HMI) released today.
April is Distracted Driving Awareness Month, and NAHB encourages members to emphasize the importance of safe driving practices to, from, and around the jobsite.
The NAHB Nominations Committee announces that Don Dabbert, Jr., CEO/President, Dabbert Custom Homes in Fargo, North Dakota, has submitted his Letter of Intent to seek certification as a candidate for NAHB 2027 Third Vice Chairman.

Home builders have already started to feel the effects of U.S. tariff policy, according to recent NAHB member surveys. This is true even though the Administration did not announce its list of reciprocal tariffs until April 2nd, lumber along with USMCA-compliant imports from Canada and Mexico were exempt, and a week later the Administration enacted a 90-day hiatus, with tariffs on countries other China limited to 10% over this time. The Administration subsequently granted further temporary exemptions from the reciprocal tariffs for a broad range of electronic products imported from China. After all this, significant uncertainty about the final outcome still remains. The U.S. may revisit trade policy for Canada and Mexico, China-U.S. negotiations are unsettled, and the effects of the 10% tariff on building products from other countries are difficult to predict. Moreover, exactly what will happen at the end of the 90-day hiatus remains unclear. In the meantime, economic uncertainty can adversely affect consumer confidence and make prospective home buyers hesitate. This is one of the reasons the NAHB/Wells Fargo Housing Market Index (HMI) declined in March. The latest NAHB estimate (based on cost data from RSMeans and PPI inflation rates) is that the average new single-family home requires $174,155 worth of building materials. Previous NAHB research has shown that 7.3% of materials in residential construction, or $12,713 of materials costs for the average single-family home, is imported. Based on this, it may seem that tariffs would have a limited effect on home builders. However, as noted above, the uncertainty caused by the mere announcement of tariffs can have an adverse effect on the behavior consumers and even businesses. In recent surveys, NAHB builders and remodelers reported that building material suppliers had already increased their prices—by an average of 5.5% and 6.9%, respectively—due to announced, enacted or anticipated tariffs. The data on builders came from the HMI survey and were collected during the first two weeks of March. The data on remodelers came from the survey for the NAHB/Westlake Royal Remodeling Market Index and were collected during the last week of March and first three days of April. NAHB will continue to monitor material prices given the uncertainty and fluidity of the tariff situation. Discover more from Eye On Housing Subscribe to get the latest posts sent to your email.
NAHB recently announced the latest winners of the Grand Awards, one of NAHB’s annual membership awards. Twenty-eight local associations and 15 state associations earned at least one Grand Award, as several associations received multiple honors.
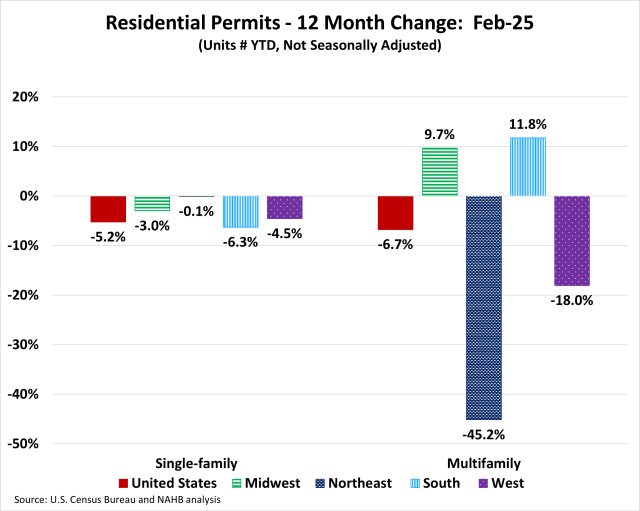
Permits continue the downward trend for the second month in a row. Over the first two months of 2025, the total number of single-family permits issued year-to-date (YTD) nationwide reached 147,119. On a year-over-year (YoY) basis, this is a decline of 5.2% over the February 2024 level of 155,236. For multifamily, the total number of permits issued nationwide reached 72,979. This is 6.7% below the February 2024 level of 78,259. Year-to-date ending in February, single-family permits were down in all four regions. The Northeast posted the smallest decline of 0.1%, the Midwest was down by 3.0%, the West was down by 4.5% and the South was down by 6.3% in single-family permits during this time. For multifamily permits, two out of the four regions posted increases. The South was up by 11.8% and the Midwest was up by 9.7%. Meanwhile, the West posted a decline of 18.0% and the Northeast declined steeply by 45.2%. Between February 2025 YTD and February 2024 YTD, 19 states and the District of Columbia posted an increase in single-family permits. The range of increases spanned 133.3% in the District of Columbia to 0.1% in New Jersey. The remaining 31 states reported declines in single-family permits with West Virginia reporting the steepest decline of 21.1%. The ten states issuing the highest number of single-family permits combined accounted for 65.6% of the total single-family permits issued. Texas, the state with the highest number of single-family permits, issued 24,960 permits over the first two months 2025, which is a decline of 5.6% compared to the same period last year. The second highest state, Florida, was down by 8.3%, while the third highest, North Carolina, posted a decline of 4.5%. Between February 2025 YTD and February 2024 YTD, 26 states and the District of Columbia recorded growth in multifamily permits, while 24 states recorded a decline. Iowa (+177.4%) led the way with a sharp rise in multifamily permits from 354 to 982, while Arizona had the biggest decline of 67.5% from 3,209 to 1,044. The ten states issuing the highest number of multifamily permits combined accounted for 63.2% of the multifamily permits issued. Over the first two months of 2025, Florida, the state with the highest number of multifamily permits issued, experienced an increase of 63.0%. Texas, the second-highest state in multifamily permits, saw a decline of 9.0%. California, the third largest multifamily issuing state, decreased by 21.7%. At the local level, below are the top ten metro areas that issued the highest number of single-family permits. For multifamily permits, below are the top ten local areas that issued the highest number of permits. Discover more from Eye On Housing Subscribe to get the latest posts sent to your email.

Did you know there are alternative ways to market your home, and you can control where and how your property is shown online? The National Association of REALTORS® published a guide to these listing options to help sellers like you understand all the ways you can display your home in the multiple listing service. Don’t worry: A REALTOR® can assist you developing the marketing strategy that’s right for you. Find one here.